|
|
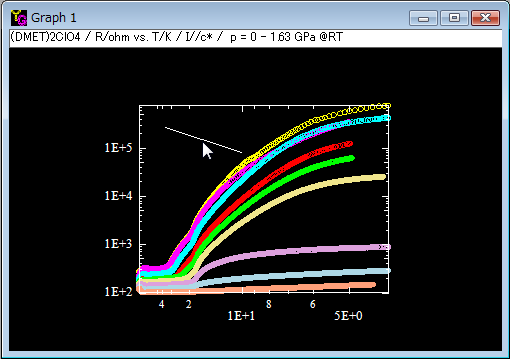
[Mouse]-[Drawing Line/Arrow]
You can draw lines and arrows in a graph by this item. If you want to control the position of lines/arrows, use [Edit]-[Line & Arrow].
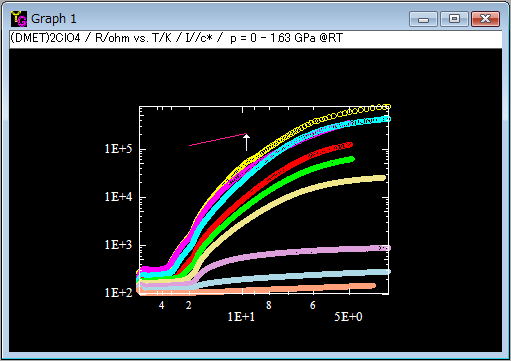
1) Click the left button of the mouse on a graph with pressing a shift key of the keyboard.

2) The mouse cursor changes to an up arrow.

3) Press the left button of the mouse at a start point of the line you want to draw. Next you drag the mouse on the graph. A pink line is drawn between the start point and the mouse cursor.
4) Release the left button of mouse. Then a line is draw on the graph. The mouse cursor goes back to the normal.

5) To translate the line, click the left button of the mouse on the middle of the line. The mouse cursor changes to a hand shape.
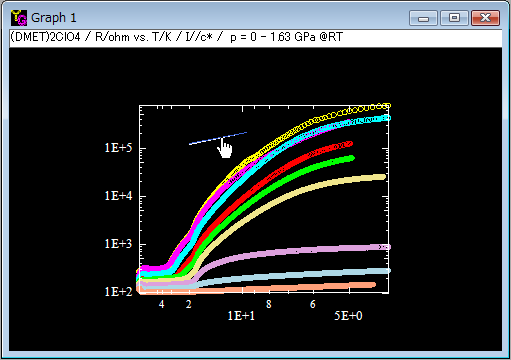
6) Drag the mouse to the new position of the line.

7) Release the left button of the mouse to finish moving the line.
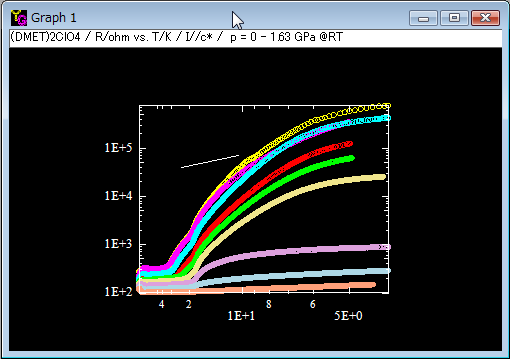
8) To change the position of one end of the line, click the mouse almost at the end of the line.

9) The mouse cursome becomes an up arrow and an pink line appears.
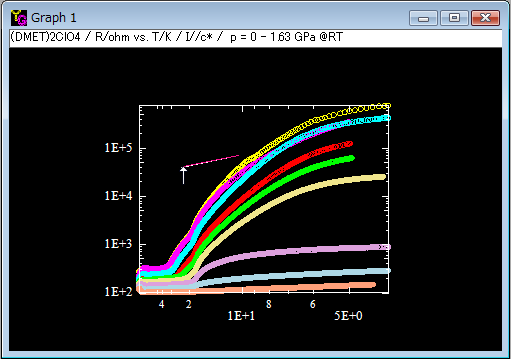
10) Move the mouse to change the slope of the line. You do not have to keep pressing the left button of the mouse.

11) Click the left button of the mouse at the new position. The line is redrawn at the new position.

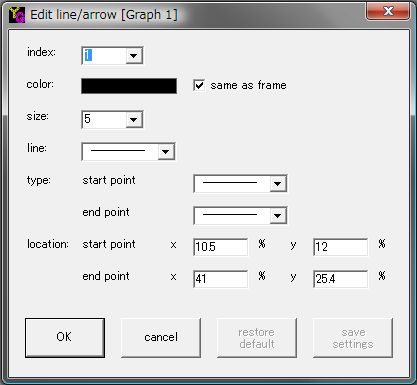
12) To edit the line, double-click the line.
13) The "Edit line/arrow" window opens. You can do the same by slecting an menu item [Edit]-[Line & Arrow]. In this window you can modify the color, size, line type, end-point shapes and the position of each end relative to the origin of the 2D graph, respectively.
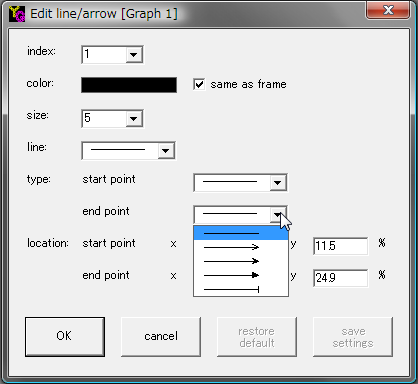
14) Here is an example to change the shapes of the end point of the line by using a compboBox.
15) Now the end point is changed to a sharp arrow. Press the "OK" button.
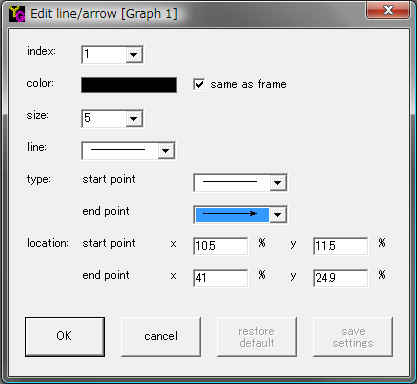
16) The line is redrawn as an arrow.

|
