|
|
[Edit]-[Expression]
download sample
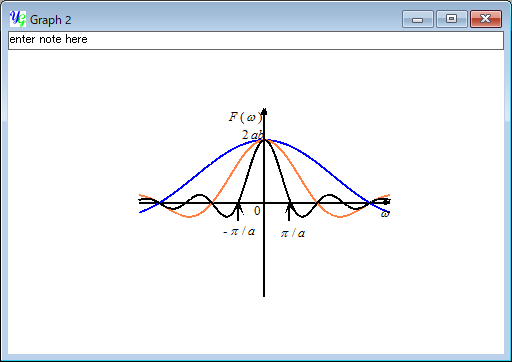
You can draw curves in the 2D graph by using mathematical functions, y = f (x). yoshinoGRAPH is using an original code to do this since Microsoft Visual C# does not give any sofisticated functions to execute a given string as a command. The original code is under development and may contain serious bugs giving wrong results. Please be careful to use this function.
[Select expression] window
The "Select expression" window will open by selecting the menu item [Edit]-[Expression].
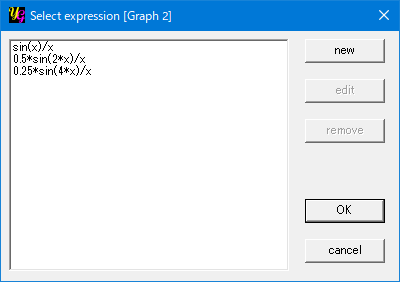
[new]
Press this button to create a new expression. Then the "Edit expression" window will open.
[edit]
If you have already created one or more expressions, they will be listed in the list-box in the left side of the "Select expression" window and this item will be enabled. By pressing this button the "Edit expression" window opens and you can edit the expression selected in the list-box.
[remove]
If you have already created one or more expressions, they will be listed in the list-box in the left side of the "Select expression" window and this item will be enabled. By pressing this button you can remove the expression selected in the list-box.
[OK]
The "Edit expression" window will close with saving the expression by pressing this button.
[cancel]
The "Edit expression" window will close without saving the expression by pressing this button.
[Edit expression] window
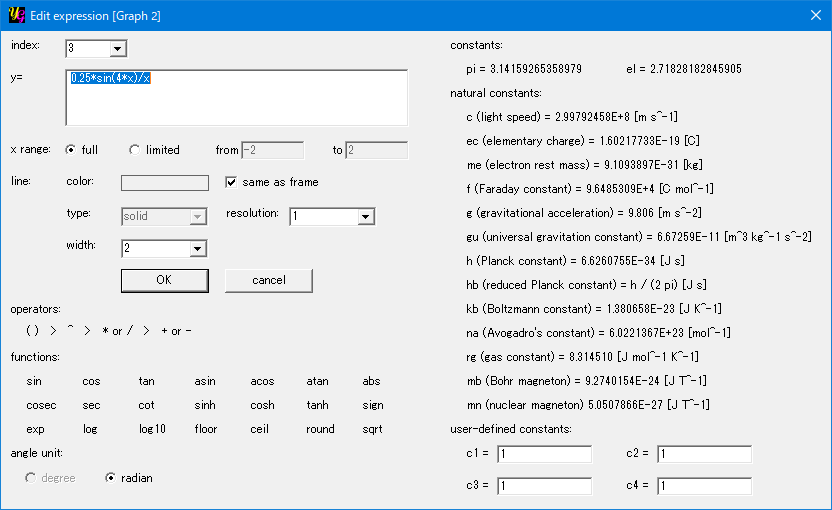
[index]
Each expression has its own index starting from 1. You can choose an existing expression by using this item.
[y=]
Here you enter a fuction of x to draw. You can use operatores, functions and constants shown in the right side of the window.
[x range]
A curve of the expression is draw in full x range of the graph when you choose "full". Or you can limit the draw range by entering the minimum and maximum positions on the x-axis by selecting "limited".
[line]
Here you can choose a few options to change appearance of the expression curve.
"color"
You can change color of the expression curve by double-clicking the pictureBox. It will be the same as the frame color when the "same as frame" option is checked.
"type"
This function is currently disabled. Only solid curve is available at present.
"resolution"
Choose smaller value of resolution, when you feel the expression curve is rough.
"width"
You can change thickness of the expression curve by this item.
[operators]
You can see the order of priority of each operators in this section. "^" represents the power operator. Namely 2^3 means 2 x 2 x 2.
[functions]
Available functions are shown in this section. See [Analyze]-[Convert Data]-[expression] to consult the meaning of each function.
[constants]
You can refer two constants. "pi" is π = 3.14159265358979 and "el" is Eular's constant e = 2.71828182845905.
[angle unit]
Only radian is available.
[OK]
The "Edit expression" window will close with saving the current expression by pressing this button.
[cancel]
The "Edit expression" window will close without saving the current expression by pressing this button.
|
