|
|
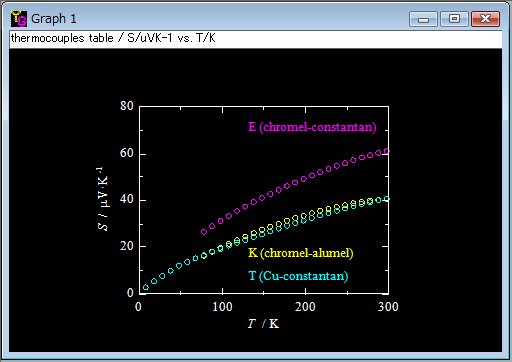
[Plot]-[Circle]
A graph is drawn in the "circle" style when this item is selected. Then data points are plotted with colored open circles. The colors of the frame and background are set to white and black, respectively. This is a trace of the DOS era when I was a graduate student. Now the background is white like paper in most graph softwares. Namely, what you see is what you get. But I still think that to distinguish data with different colors is easier on the black background than on the white.
For printing and presentations, use the "presentation" plot.
|
