|
|
[Analyze]-[Fit Spline Curve]
download sample
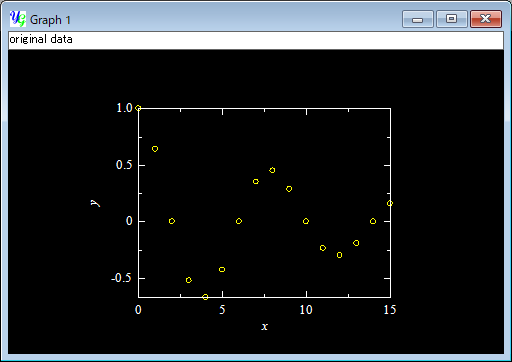
You can fit third spline curves to the data in the 2D graph by this item. Polynomial fits sometimes fail to connect data points because it is difficult to reproduce a complicated function of real experimental data with a smooth polynomial function. But a fitted function is sometimes required to pass every data point to make a data table from experimental data. The third spline curves are often used for this kind of purpose. Please consult a textbook about details of the spline functions.
The "Fit 3rd-spline curve" window will open by selecting the menu item [Analyze]-[Fit Spline Curve].
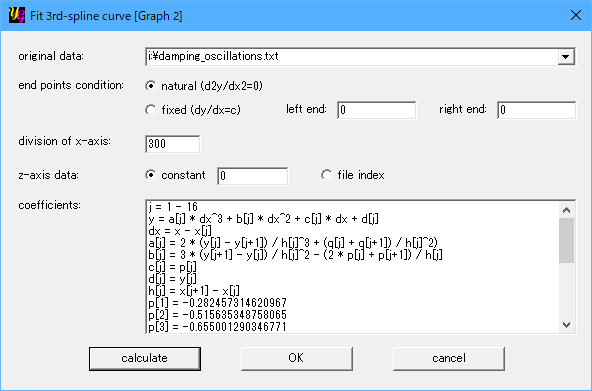
[original data:]
You can select one of the data files in the graph by selecting its file name in the list-box. If there exist "white" data, the corresponding item appears in the list. Then you can fit a series of spline curves only to the "white" data. To create "white" data, use [Analyze]-[Data Point].
[end points condition:]
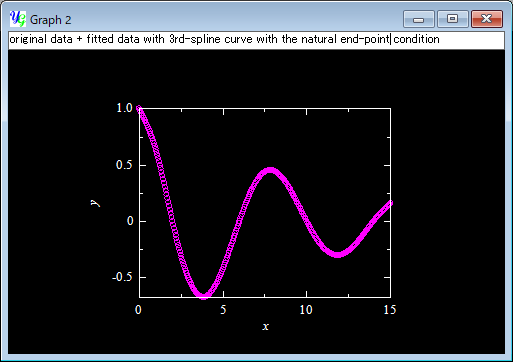
In natural spline curves, the end-point conditions are determined by the natural condition d2y/dx2=0. This gives linear ends of the fitted curve.
If you have fixed slopes at the ends, you can choose the fixed condition dy/dx=c. Then you need to enter the slopes at the left and right ends into the neighboring textboxes.
[division of x-axis:]
The fitted function is plotted as new descrete data points. The data points are generated in the plot range of x. This item shows the division of the x-axis to generate the new data. The number of the new data points will be n+1, when you enter n in the text-box.
[coefficients:]
This item shows the result of the calculation. The spline curves are a series of the third polynomial functions connected to one another at the given data points. The coefficients define these third polynomial functions.
[calculate]
Push this button after setting the "original data", "end points condition" and "division of x-axis". If there are enough many data points, calculations are carried out and the results are shown. Then "OK" button becomes active. If you do not like the result, you can change the above settings and press this button again.
[OK]
This button becomes active after calculations are carried out. Data points of the fitted curve will appear on the graph by pressing this button.
[cancel]
You can cancel the job on this window by pressing this button, if you do not need the result.
|
