|
|
[Edit]-[Superpose]
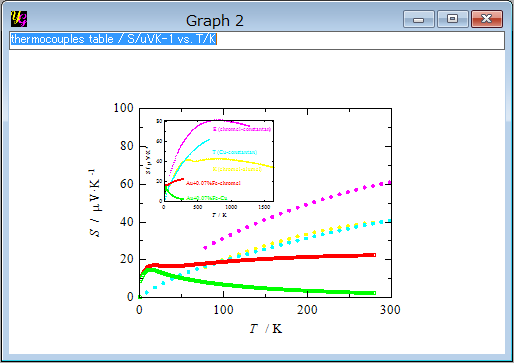
One can superpose other graphs on a graph in a child window with this function. One needs to have at least two graphs in a project to do this. There are Graph 1 and Graph 2 in the following example. When you want to superpose Graph 1 onto Graph 2, activate Graph 2 by clicking somewhere on the Graph 2 child window.
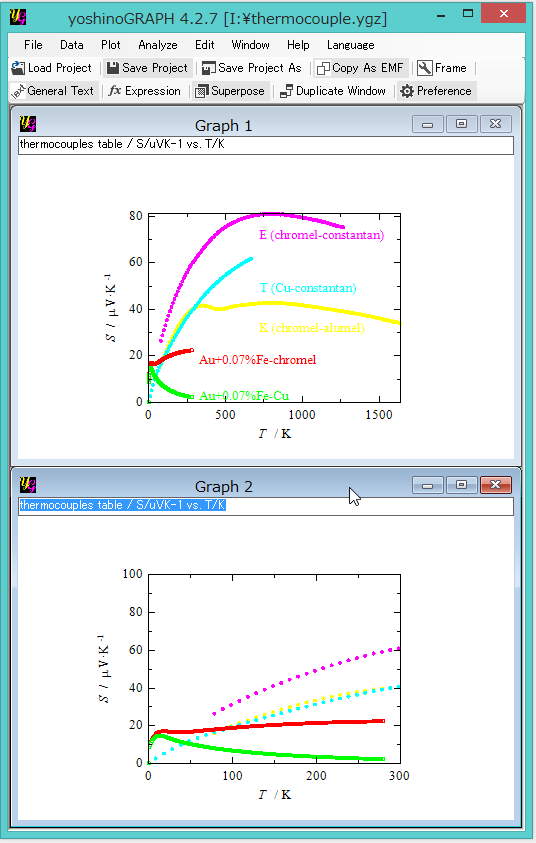
After selecting [Edit]-[Superpose] in the menu, the "Superpose graphs" window opens.
[Superpose graphs] window
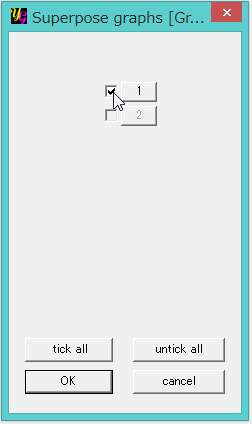
Check-boxes
By ticking a check-box, one can select which graphs are superposed onto the currently activated graph.
Number buttons
The "Edit superposed graph" window opens by clicking each button. Read the next section for deatails.
[tick all]
One can tick all available graphs other than the currently activated graph by clicking this button.
[untick all]
One can untick all graphs with this button.
[OK]
One can close the window with enabling the last settings with this button.
[cancel]
One can close the window with discarding the last modification here with this button.
[Edit superposed graph] window
One can set locations of the superposed graph by entering numbers with this window. And one can select whether the superposed graph is drawn at top layer or bottom one in the graph window.
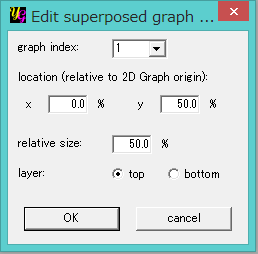
[graph index]
One can select an existing superposed graph by this combobox when plural graphs are superposed on a main graph.
[location (relative to 2D Graph origin)]
One can precisely locate the superposed graph by entering numbers in % as x- and y-positions relative to the origin of the main graph when it is drawn in 2D style.
[relative size]
One can change size of the superposed graph relative to the main one by entering number to this text-box.
[layer]
When "top"/"bottom" is selected, the superposed graph is drawn in front of/below the main graph.
[OK]
One can close the window with enabling the last settings with this button.
[cancel]
One can close the window with discarding the last modification here with this button.
After closing the "Superpose graphs" window by clickng the "OK" button, one will have the graphs like below.
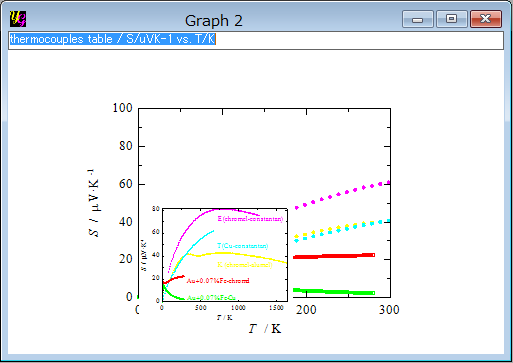
When one wants to move the superposed graph within the graph window, one can drag it by a mouse. Try to point the mouse cursor around the center of the superposed graph. Then a blue rectangle appears and one can move it.
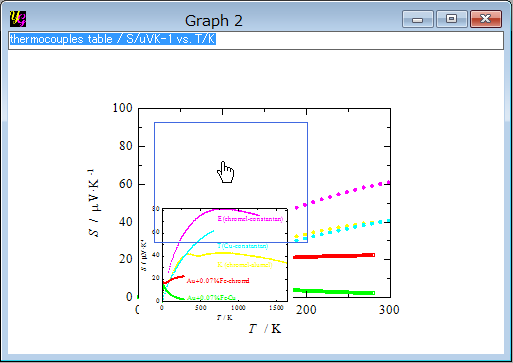
One will have the graphs like below after releasing the mouse button.
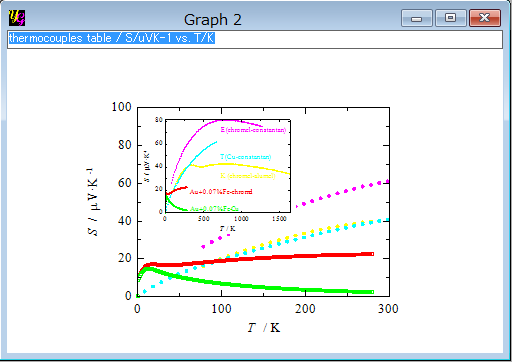
When one wants to change the size of the superposed graph, try to drag one of its corners. Then a red rectangle appears and one can change its size by moving the mouse curosr.
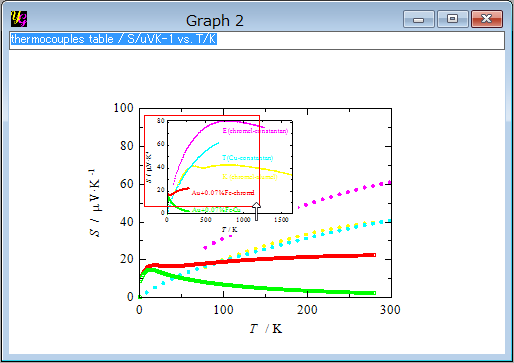
Even after making the size of the superposed graph small, one will find the left-bottom corner of the superposed graph hides some data points of the main graph as marked with the red circle in the next figure. This is because the background of the superposed graphs is painted with white color.
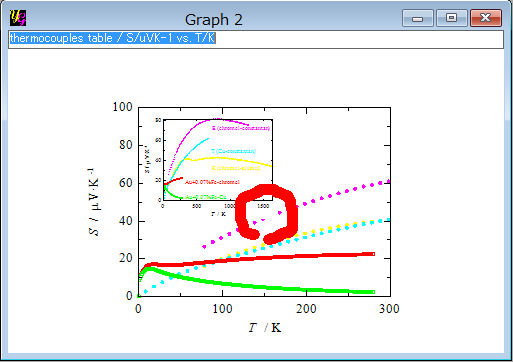
There are two ways to fix it. One it to make the layer setting of the superposed graph to "bottom" in the "Edit superposed graph" window described above. The other is to make the background color of the Graph 1 transparent. To do so, one activates Graph 1 and select [Edit]-[Frame] in the menu. The "Edit frame" window will open. Tick the checkbox next to "none" in the "whole back color" section. One will get Graph 1 as below after closing the "Edit frame" window.
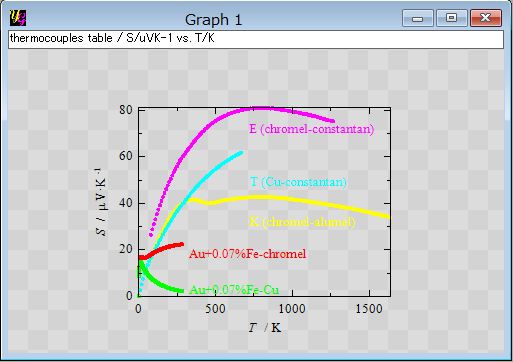
One goes back to Graph 2 again and select [Plot]-[Replot] in the menu. Now one will have the graphs like below. This is because the superposed graph is linked to the original one and any changes in it are reflected on the superposed one.
|


