|
|
[Plot]-[Custom]
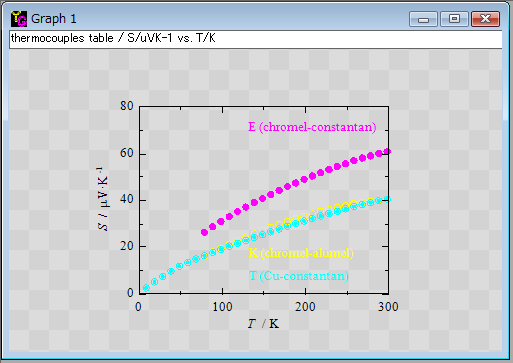
A graph is drawn in a customized style by selecting this item. In this style, many settings in drawing graph can be customized through [Data]-[Select Column], [Edit]-[Frame] and so on.
The transparent color is used in the default settings as the background color of this style. The "transparent" color is different from the "white" color. You will see the difference when you paste an extended metafile creaded by [File]-[Export Active Graph] onto a colored slide of a presentation software. In a graph window of yoshinoGRAPH, the "transparent" color is expressed by a tiling image of light and dark gray squares.
The numbering style of axes is also different from that in the other styles such as "circle" and "symbol". A number with an index, for example, 3.5E-8 is drawn in the conventional way in mathematics like 3.5×10⁻⁸ in the "presentation" style, while it is drawn like "3.5E-8" in the other styles.
|
