|
|
[Mouse]-[Changing Axis Scale]
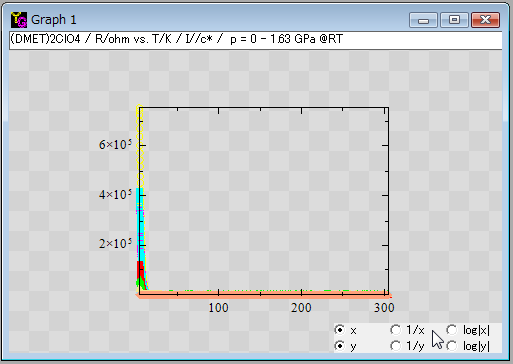
You can change the scale type of each axis by clicking radio buttons at the right-bottom corner of each graph using a mouse. This does not change data value itself. If you like to do so, use [Analyze]-[Convert Data].
1) You have data spread in a wide range, for example, temperature dependece of electrical resistivity.
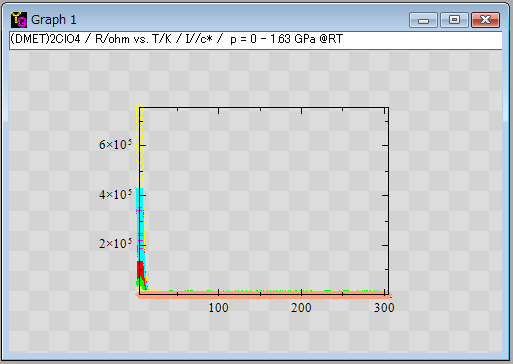
2) Move the mouse cursor to the right-buttom corner of a graph window. Then radioButtons appear. You see the default setting is "linear" for both the x- and y-axes.
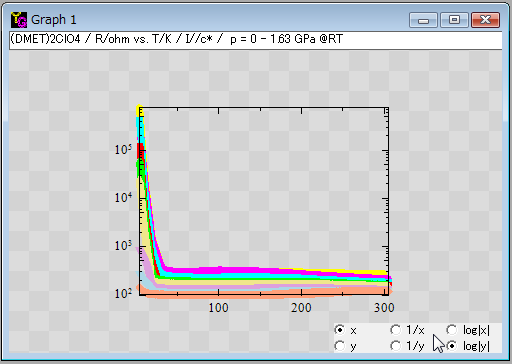
3) The right panel is the result of clicking the "log|y|" radioButton that means the common logarithm (log10) of the absolute value of y. The reason of taking the absolute value is to avoid an error on applying the "log" function to a possible minus value.
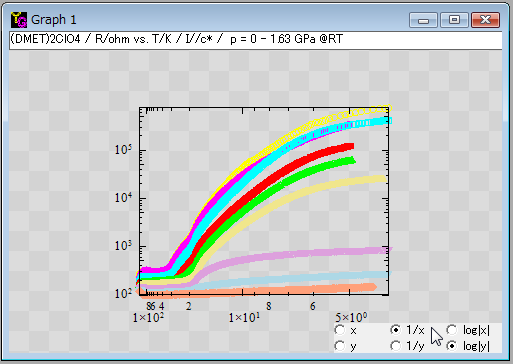
4) Further the right panel is the result of clicking the "1/x" radioButton that means the inverse of x. This kind of plot (log y vs. 1/x) is known as Arrhenius (or activation type) plot.
|
