|
|
[Analyze]-[Fit Power Polynomial]
download sample
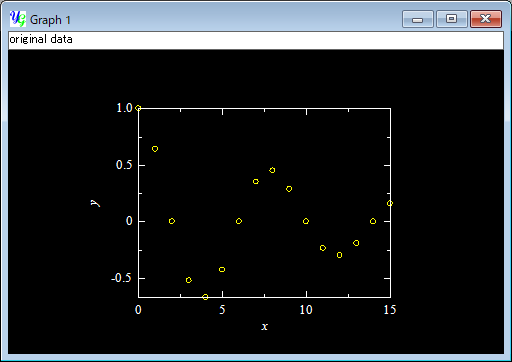
You can fit a polynomial function of x to the data in the 2D graph by this item.
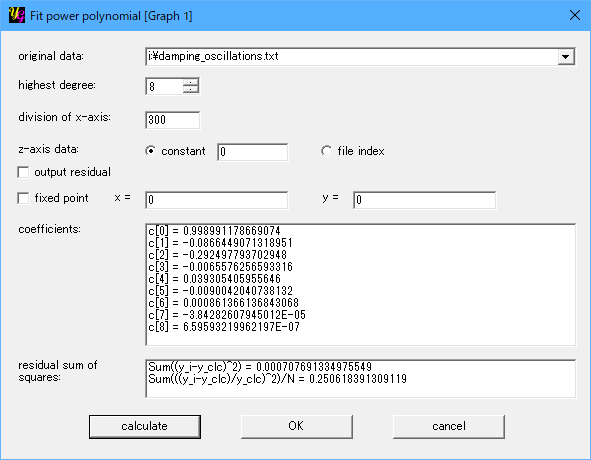
The "Fit power polynomial" window will open by selecting the menu item [Analyze]-[Fit Power Polynomial].
[original data]
You can select data sets used to calculate a regression line from the list-box.
"All data" is the default selection. Or you can select one of the data files in the graph by selecting its file name. If there exist "white" data, the corresponding item appears in the list. Then you can fit a polynomial function only to the "white" data. To create "white" data, use [Analyze]-[Data Point].
[order of polynomial]
You can select order of the polynomial function of x to be fitted to the selected data. When the order is n, the number of the data points used shoulde be n+1 and more.
[division of x]
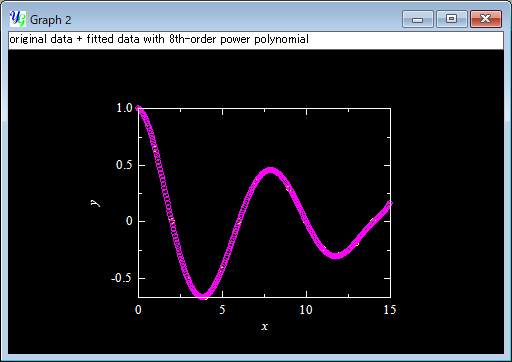
The fitted function is plotted as new descrete data points. The data points are generated in the plot range of x. This item shows the division of the x-axis to generate the new data. The number of the new data points will be n+1, when you enter n in the text-box.
[output residual]
You can select whether or not to generate the residual data points as the second new data set as well as the first set for the fitted curve. Make a mark on this item to do this.
[fixed point]
If you want to fix a point in the fitted curve in the x-y space, make a check in this item and enter values of x and y in the neighboring text-boxes.
[coefficient]
This item shows the result of the least-squares calculation to fit a polynomial-curve. c[0] is the constant term. c[n] represents the coefficient of the n'th-order term.
[residual]
This item shows the sum of the square of residual, in other words, the distance between each data point and the fitted curve, y-yfit. The least-squares calculation is carried out to minimize the sum. yoshinoGRAPH also calculates the normalized one that is the sum of square of (y-yfit)/yfit.
[calculate]
Push this button after setting the "original data", "order of polynomial", "division of x-axis" and "fixed point" (if needed). If there are enough many data points (>=n for the n'th order), calculations are carried out and the results are shown. Then "OK" button becomes active. If you do not like the result, you can change the above settings and press this button again.
[OK]
This button becomes active after calculations are carried out. Data points of the fitted curve will appear on the graph by pressing this button.
[cancel]
You can cancel the job on this window by pressing this button, if you do not need the result.
|
