|
|
[Analyze]-[Data Point]
The "Edit data points" window opens by selecting this item and you can edit data in the graph one by one.
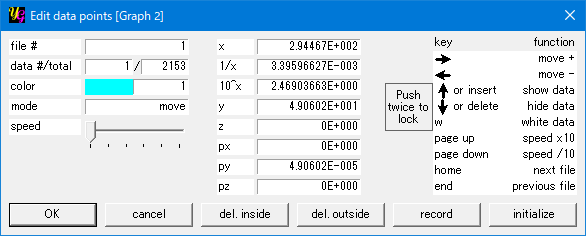
[file #]
This shows the index of the file where the cross cursor is on a data point in it.
[data #/total]
This item shows the position of the data point in the sequence of the data file shown in [file #]. The number after "/" is the total number of data in the file. This might be changed when you convert data by [Analyze]-[Convert Data].
[x]
The value of x of the selected data point is shown here.
[1/x]
This shows the inverse of x value of the selected data point.
[10^x]
This shows the x'th power of 10 for the selected data point.
[y]
The value of y of the selected data point is shown here.
[z]
The value of z of the selected data point is shown here.
[color]
This shows auto color of the data point.
[key] section
[→]
By pressing the right arrow key on the keyboard, the cross cursor on the graph moves so as that "data #" increases.
[←]
By pressing the left arrow key on the keyboard, the cross cursor on the graph moves so as that "data #" decreases.
[↑ or insert]
By pressing the "up-arrow" or "insert" key once, you can make the data point at the cross cursor visible.
By pressing twice the "mode" changes from "move" to "recover". In the "recover" mode you can make invisible data visible quickly just by moving the cross cursor with the "right-" and "left-arrow" keys.
When you press the "up-arrow" or "insert" key again, the mode becomes to "move". In the "move" mode, the color of data is not changed and you can just read its x, y and z values on the "Edit data points" window.
[↓ or delete]
This function is useful when you want to remove scattered data from the graph quickly
By pressing the "down-arrow" or "delete" key once, you can make the data point at the cross cursor invisible.
By pressing twice the "mode" changes from "move" to "delete". In the "delete" mode you can make visible data invisible quickly just by moving the cross cursor with the "right-" and "left-arrow" keys.
When you press the "down-arrow" or "delete" key again, the mode becomes to "move". In the "move" mode, the color of data is not changed and you can just read its x, y and z values on the "Edit data points" window.
[w]
By pressing the "w" key once, you can make the data point at the cross cursor "white". "White" color data have a special meaning in yoshinoGRAPH You can apply the operations only to the "white" data in [Analyze]-[Convert Data], [Fit Regression Line] and so on.
By pressing twice the "mode" changes from "move" to "white". In the "white" mode you can make visible/invisible data white quickly just by moving the cross cursor with the "right-" and "left-arrow" keys.
When you press the "w" key again, the mode becomes to "move". In the "move" mode, the color of data is not changed and you can just read its x, y and z values on the "Edit data points" window.
[page up]
By pressing "page up" key you can increase speed of the cross cursor.
[page down]
By pressing "page up" key you can decrease speed of the cross cursor.
[home]
When two or more data files are included in the current graph, you can move the cross cursor directly from a data point of a current file to the first data point of the next file in the plot range by pressing "home" key.
[end]
When two or more data files are included in the current graph, you can move the cross cursor directly from a data point of a current file to the last data point of the previous file in the plot range by pressing "end" key.
[mode]
This shows the edit mode that is changed by pressing some keys noted above.
In the "move" mode, the color of data is not changed and you can just read its x, y and z values on the "Edit data points" window.
In the "delete" mode, the color of data is changed into "black" or invisible.
In the "recover" mode, the color of data is changed into its original one.
In the "white" mode, the color of data is changed into "white".
[speed]
The slide-bar shows the speed of the cross cursor that is changed by pressing the "page up" or "page down" key. By moving the slide-bar by the mouse, you can change the speed directly.
buttons section
[input data]
This item is to imput data by entering numbers. But the function has not been implemented yet.
[del. inside]
You can make the data inside of the plot area invisible by pressing this button.
[del. outside]
You can make the data outside of the plot area invisible by pressing this button.
[record]
You can keep the last result of operations in this window as well as in the "Convert data" window opened by [Analyze]-[Convert Data] by pressing this button. After doing this you cannot go back to the initial condition of the data just after reading the data files.
[initialize]
For all the data you can cancel all the operations in this window as well as in the "Convert data" window opened by [Analyze]-[Convert Data]. The data values and colors go back to their initial ones as were read from the data files or to the recorded ones just after clicking the "record" button.
[OK]
The "Edit data points" window is closed with keeping results of the current operations.
[cancel]
The "Edit data points" window is closed without keeping results of the current operations.
|
