updated on Nov. 28, 2012
Sreen shots
A running image of yoshinoGRAPH with four child windows of different graph types.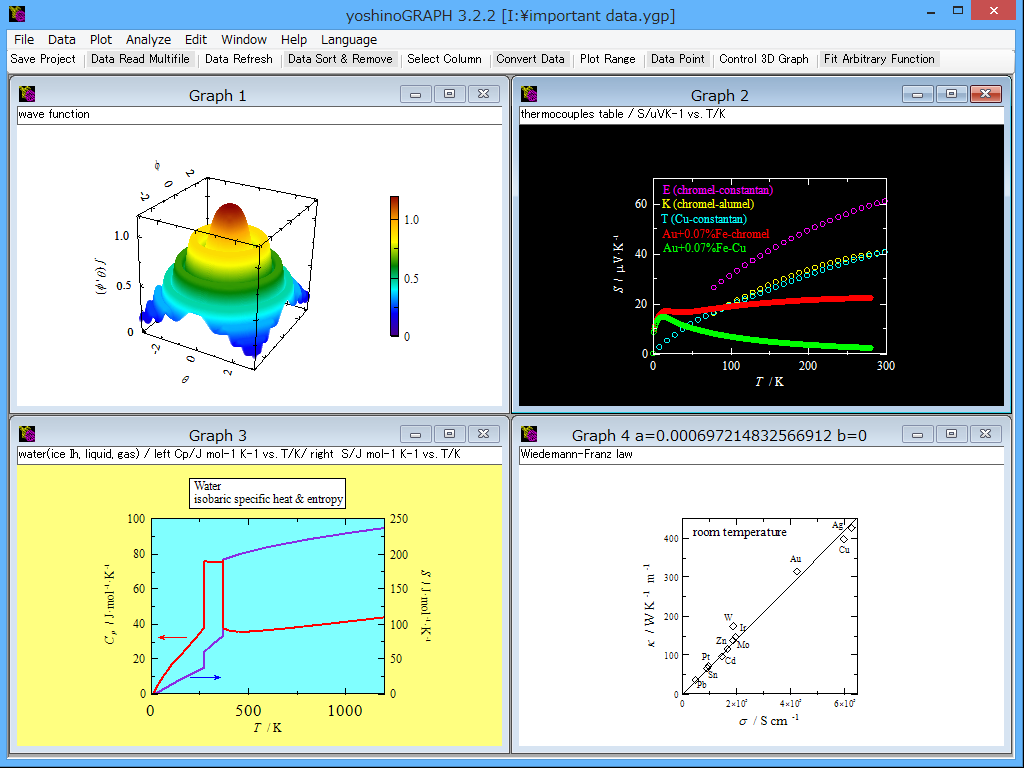 |
Multilocation-multifile selector to read data files quickly.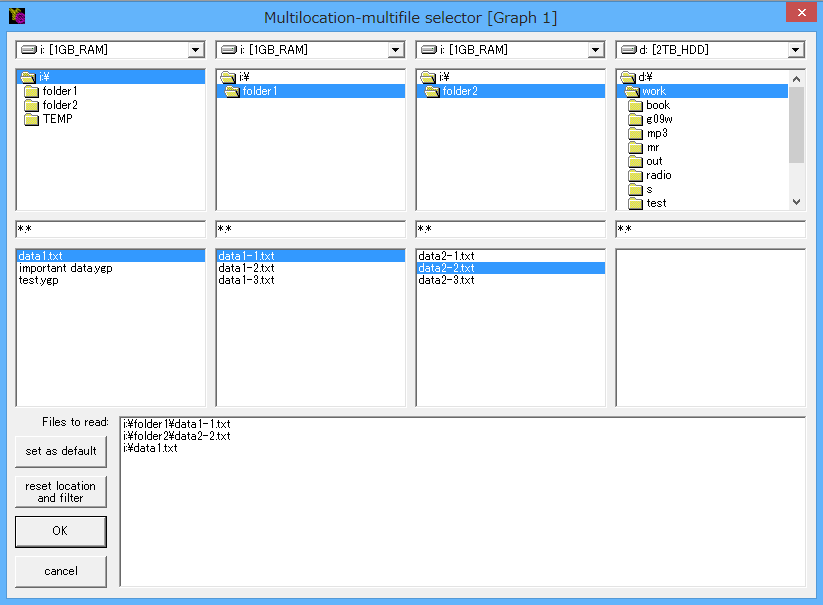 |
A lot of functions to convert data.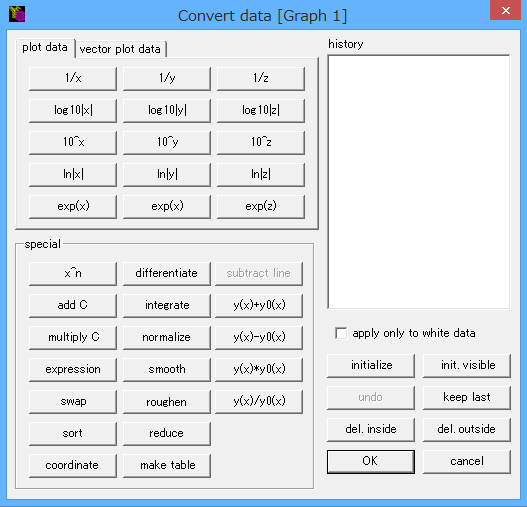 |
The window to fit data to an arbitrary function with up to 10 parameters.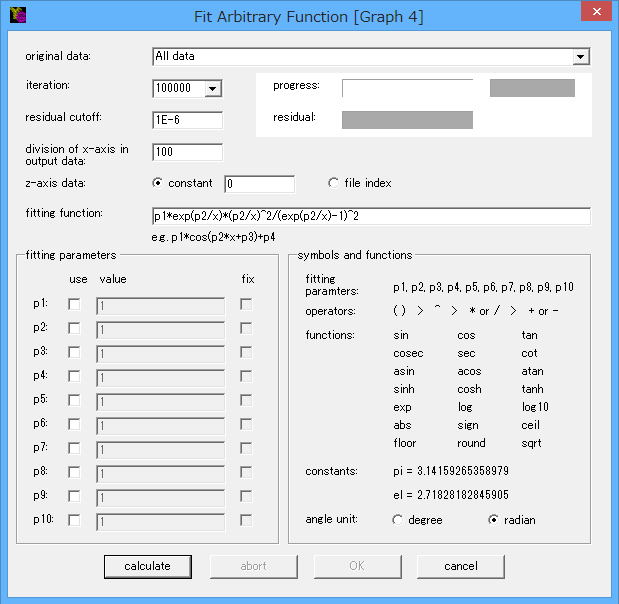 |
A circle plot and editing data points.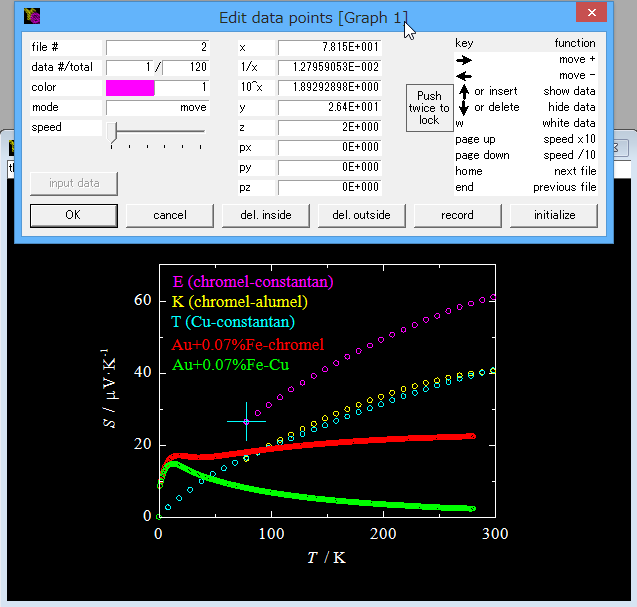 |
A dot plot showing radio-buttons to change axis styles.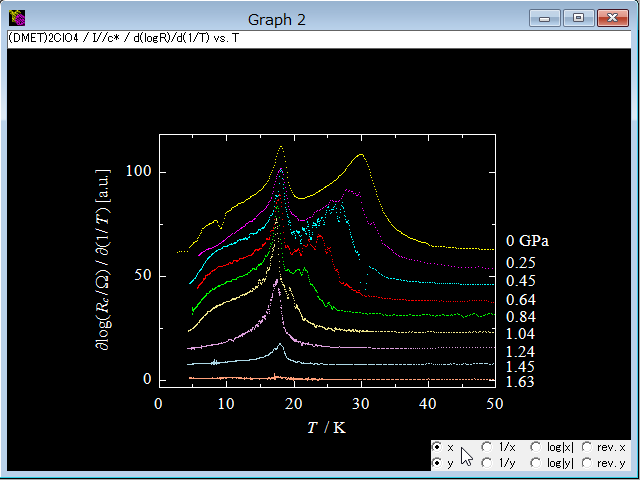 |
A symbol plot with aspect ratio of 1:1 and a regression line.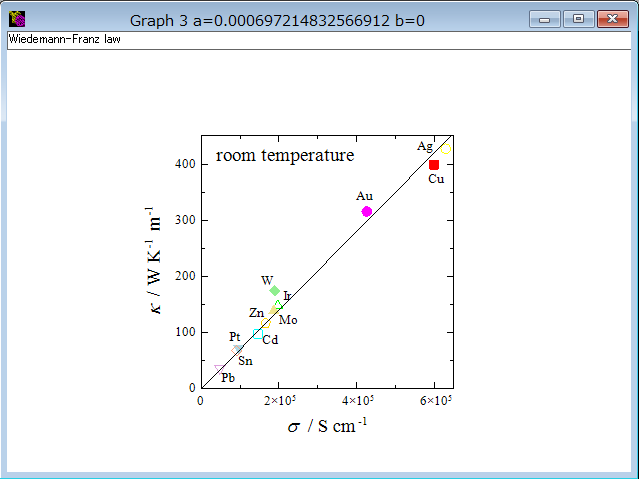 |
A presentation plot with enlarged fonts, colored background and a boxed label.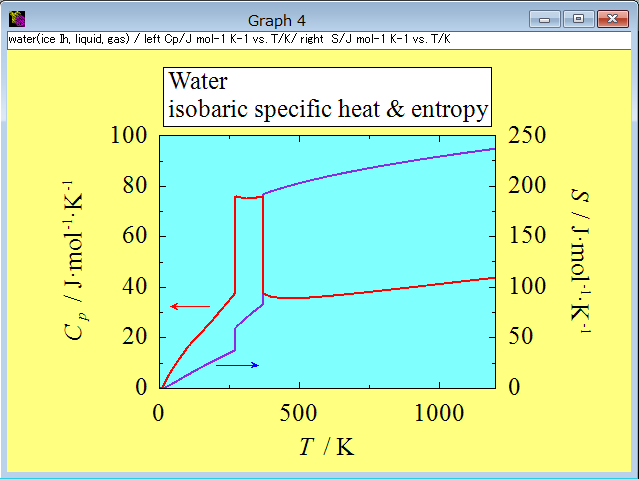 |
A presentation plot with shifting each data curve depending on the z-axis value.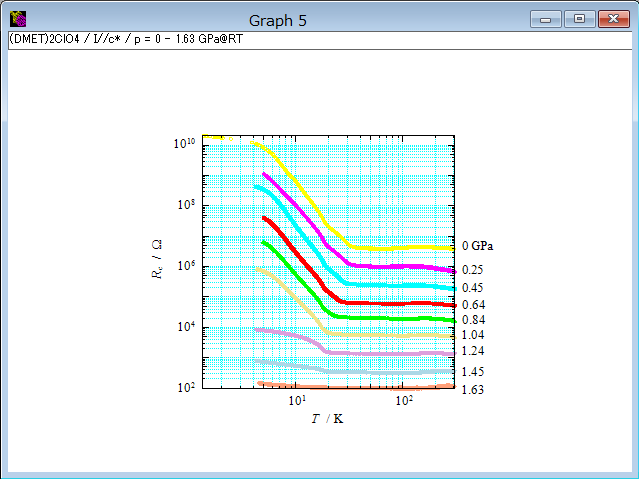 |
A 3D plot with circles using the same data above.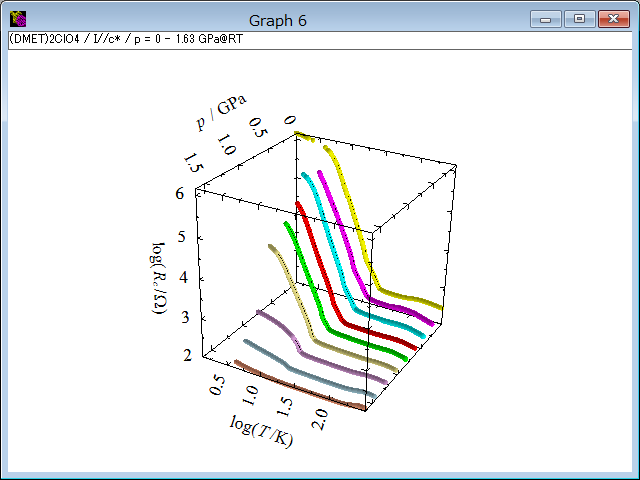 |
A density plot of bicolor.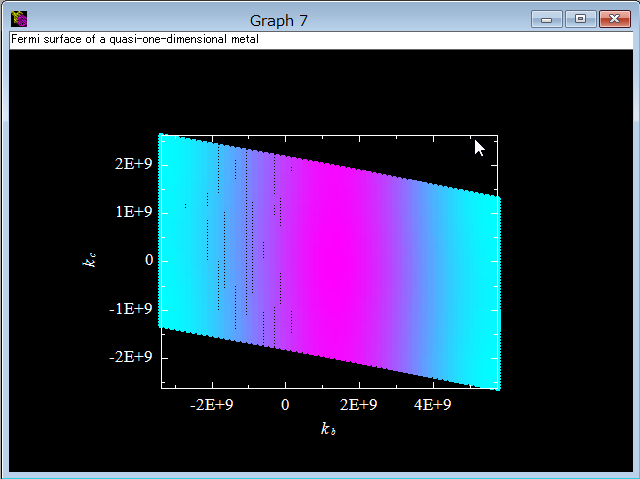 |
A density plot of rainbow color.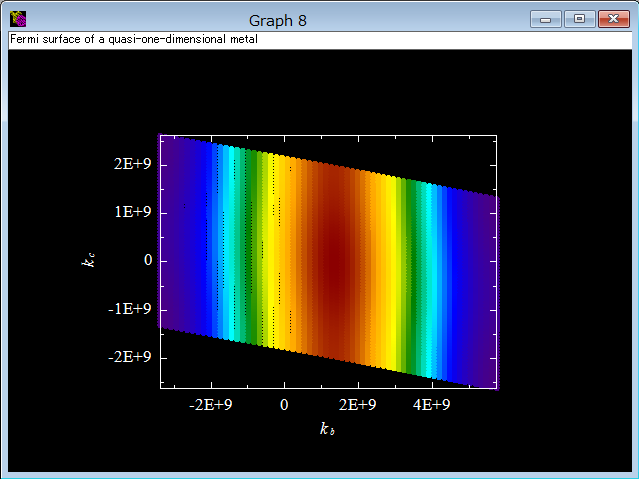 |
A 3D plot with half-transparent rainbow color and a color scale.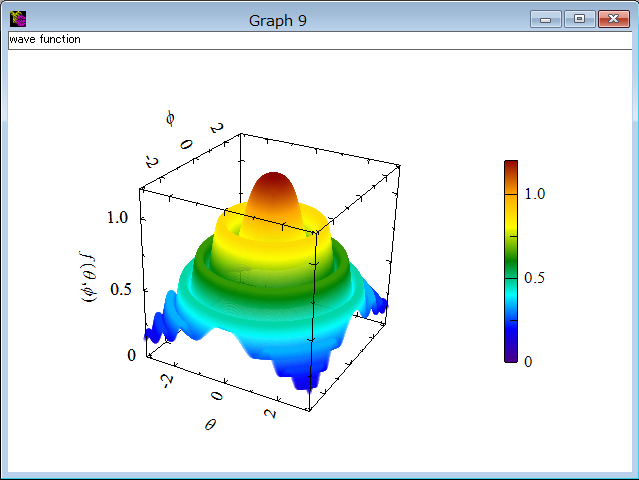 |
Superposing another graph in an enlaged scale on that in a wider scale. |