Welcome to the world of yoshinoGRAPH!!!
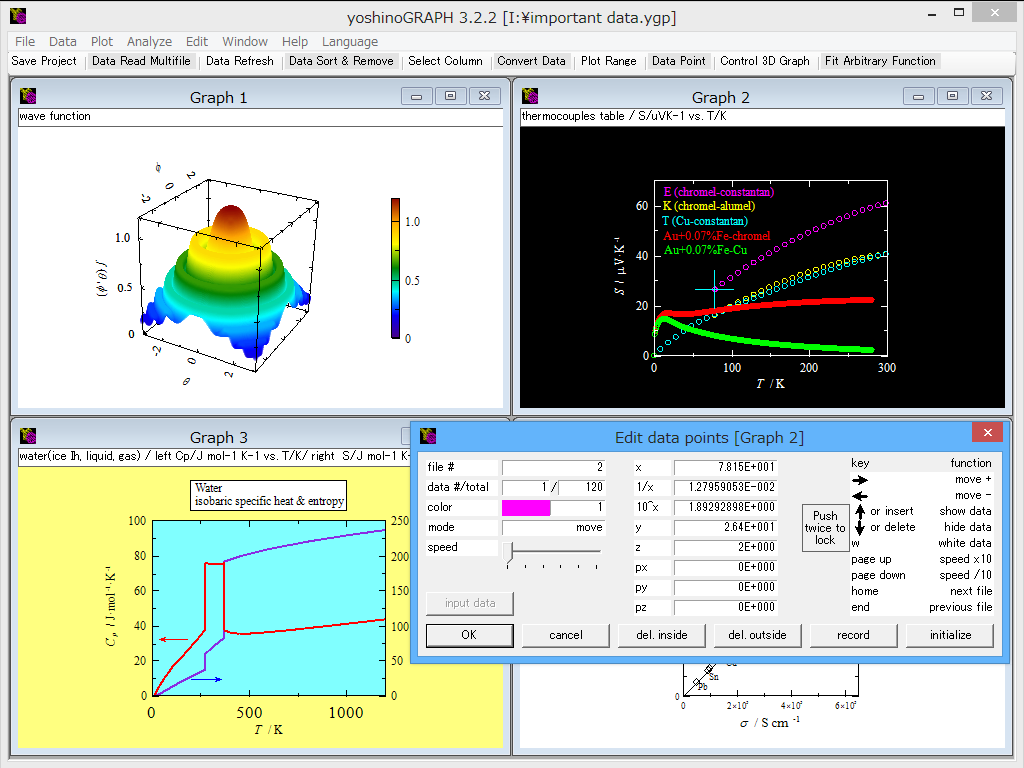
yoshinoGRAPH is a scientific graph software for data analysis and presentation. You can make 2D and 3D graphs quickly from data files in text format. This software is tiny but includes many basic functions to analyze/edit data as well as rather advanced ones. Followings are some features of yoshinoGRAPH

-free
-plot styles: scatter charts, density and 3D plots with options
-a lot of color, symbol and other style options
-double y-axis and shift in y direction are available in 2D graph
-easy to read many data files saved in different folders
-easy to change scales among linear, log and inverse
-easy to convert data using many mathematical functions
-easy to remove scattered/noisy points in experimental data
-easy to write axis labels and other texts
-numerical differentiation and integration of data
-quick sort of data
-smoothing and roughening of data
-calculating difference and ratio between two series of data
-making tables with an equal interval in several ways
-manual fit of two independent lines to a data curve
-least-squares fit to power polynomials
-least-squares fit to Chebyshev, Legendre and Fourier polynomials
-least-squares fit to 3rd spline curves
-non-linear fit to Gaussian curves
-non-linear fit to arbitrary functions with 10 parameters
-Fourier transform using FFT, DFT and numerical integral
-to draw a math function on 2D graph using an expression
-to copy graphs as extended-metafile and bitmap formats to clipboard and files
-to print hard copies of graphs
yoshinoGRAPH has been developed for myself as well as my students to handle data of transport phenomena of organic conductors, but I wish it also assists you to proceed your own research.
Harukazu YOSHINO
Osaka, Japan
|

