|
|
[Analyze]-[Fit Regression Line]
This item allows you to fit a line to data in a 2D plot by the least-squares calculation.
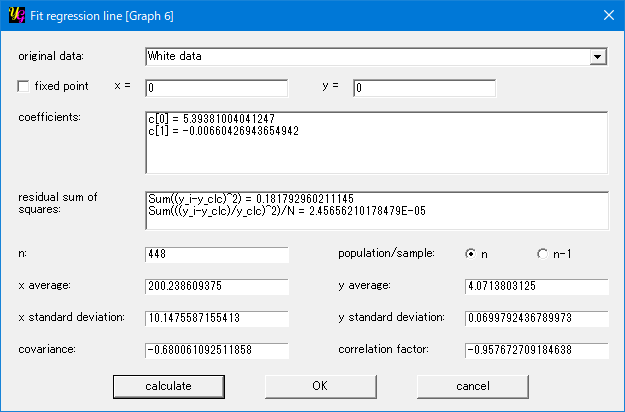
[original data]
You can select data sets used to calculate a regression line from the list-box.
"All data" is the default selection. Or you can select one of the data files in the graph by selecting its file name. If there exist "white" data, the corresponding item appears in the list. Then you can fit a line only to the "white" data. To create "white" data, use [Analyze]-[Data Point].
[fixed point]
When you want the fitted line to pass a fixed point, make a check on this item. And you enter x and y values of the fixed point in the text boxes.
[coefficients]
The item shows the coefficients of the fitted curve. "c[0]" is the constant term and "c[1]" is the coefficient of the linear term, respectively.
[residual]
This item shows the sum of the square of residual, in other words, the distance between each data point and the fitted line, y-yfit. The least-squares calculation is carried out to minimize the sum. yoshinoGRAPH also calculates the normalized one that is the sum of square of (y-yfit)/yfit.
[n]
This item shows the number of data used to calculate the regression line.
[statistics option]
Please consult a textbook of statistics, if you are not familier with this option. Or use the default option "n". The results will be changed when "n-1" is selected.
[x average]
This item shows the average of x over the all data used in the calculation.
[x standard deviation]
This item shows the standard deviation of x over the all data used in the calculation.
[y average]
This item shows the average of y over the all data used in the calculation.
[y standard deviation]
This item shows the standard deviation of y over the all data used in the calculation.
[covariance]
This item shows the covariance of x and y over the all data used in the calculation.
[correlation factor]
This item shows the correlation factor between x and y over the all data used in the calculation.
[calculate]
Push this button after setting the "original data", "fixed point" (if needed) and "statistics option". If there are enough many data points (>=2), calculations are carried out and the results are shown. Then "OK" button becomes active. If you do not like the result, you can change the above settings and press this button again.
[OK]
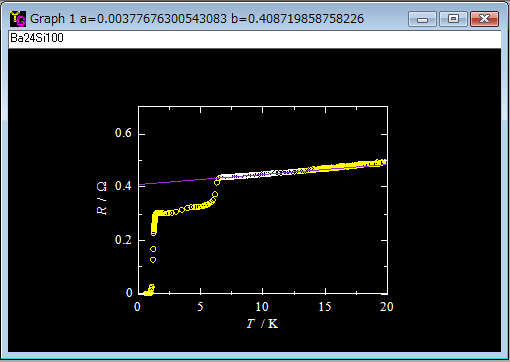
This button becomes active after a calculations is successfully finished. The least-squares (regression) line will appear on the graph by pressing this button. The calculated slope (a) and intercept (b) will be shown in the title of the graph window.
[cancel]
You can cancel the job on this window by pressing this button, if you do not need the result.
|
