|
|
[Data]-[Select Column]
The "Data selector" window is opened by this item or after selecting data files by [Data]-[Read] and [Data]-[Read Multifile]. You can assign one of multi-dimensional columns to x-, y-, z-, px-, py- and pz-axis, respectively. "x-", "y-" and "z-" are used to determine the symbol position in 2D or 3D graphs. "px-", "py-" and "pz-" data are used in "density" and "vector" plots or to draw error bars.
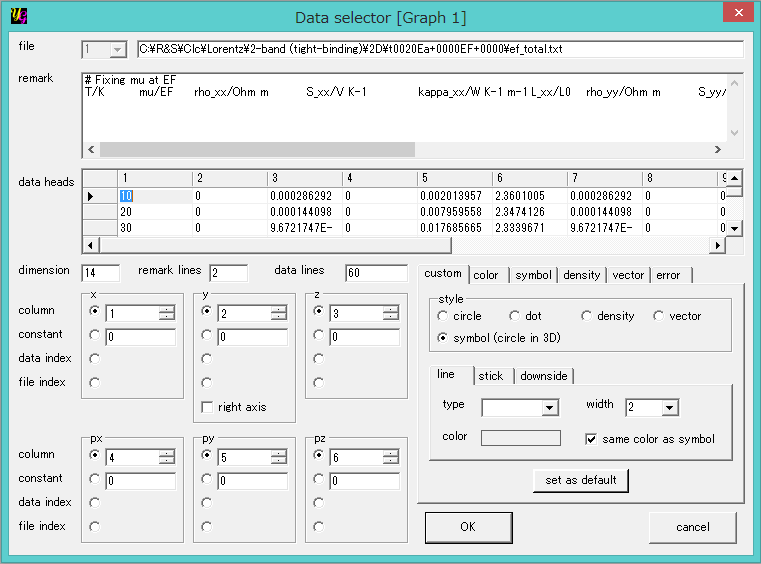
[file]
The file whose settings are shown is switched by selecting the corresponding file number in the list-box. Its name is shown in the neighboring text-box.
[remark]
Remark texts at the head and/or tail of each data file are shown in this section. yoshinoGRAPH automatically detects texts other than numeric data in data files.
[data]
Numeric data at the head of the data file are shown in this section as a spread sheet. The numbering of each column is used to assign the column to one of x-, y- znd z-axes.
[dimension]
This shows the number of columns in the current data file.
[remark lines]
This shows the number of remark text lines shown in the [remark] section.
[data lines]
This shows the number of data lines shown in the [data] section.
[x], [y] and [z]
These are used to determine the position of each plot symbol in 2D or 3D graphs. Four kind of data can be assigned to each axis at this section. The first is [column]. One of data columns is assigned to an axis data. The numbering of the prefered column is selected in the list-box to do this.
The second is [constant]. The data of an axis can be set to a constant. To do this a radio-button in the line of [constant] is checked and a preferred number is entered in the neighboring text-box.
The third and fourth are [data index] and [file index], respectively. When you check a radio button in the [data index] line, data in the selected axis beccome a series of integers from 1 to the number of data lines in the file. This is convenient to make a plot from an single-column data. On the other hand, the [file index] is the file number itself. This is convenient to distinguish each two-dimensional data files by [file index].
[right axis]
This is an option for y-axis data. This option becomes effective for the second or later files. Check this option to make a double y-axis plot.
[px], [py] and [pz]
These are used to determine symbol color in the "density" plot or to draw vector arrows in the "vector" plot. Or they are also used to draw error bars along x-, y- and z-axis, respectively, though error bars in 3D graphs are currently unavailable.
[custom] tab
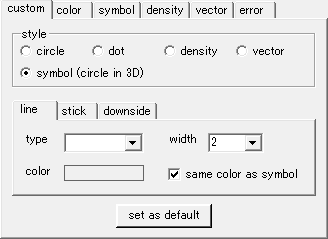
This tab is used to select the plot style of the "custom plot" shown by [Plot]-[Custom]. At present "symbol", "circle", "dot", "density", "vector" plots are available. The selected style becomes the default one by pressing the [set as default] button.
[color] tab
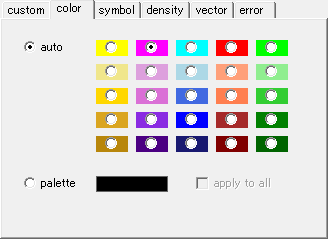
This tab is used to select colors of plot symbols. The default color style is [auto]. This automatically assigns a color to each data file from the 25 prepared colors. By selectig [palette] you can use a costumized color. Click the neighboring pictire-box to chnage colors to use. By checking the [all data] option you can use the same customized color for all data file.
[symbol] tab
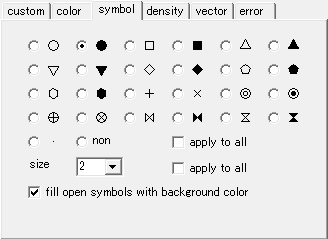
This tab is used to select a symbol in the "symbol" and "custon" plots. To change its color use the [color] tab. By making a check on [all data] you can use the same symbol for all data files.
[size]
You can change sizes of the symbol by using the list-box in the section. Making a check on the [all data] option enables you to apply the same symbol size to all the symbols used in the same graph.
[density] tab
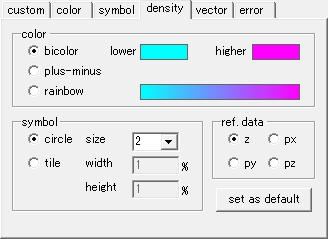
[color] section
One can select color type of "density" plot where symbol color depends on z-, px-, py- or pz-data. The data are called "reference data". "Bicolor" makes the density color by blending the "lower" and "higher" colors that can be selected by clicking each picture box at right-hand side. "Plus-minus" is similar to "bicolor" but the color is set to white when the reference data is zero. And the "higher"/"lower" color and white is blended for plus/minus value of the reference data. The third option "rainbow" makes the plot color by blending neighboring colors of the seven rainbow ones.
[symbol] section
One can select plot symbols from "circle" and "tile" by checking one of the radio-buttons here. The "size" combo-box is for changing the size of the circle. The "width" and "height" are for "tile" and the values relative to the size of x- and y-axis, respectively. The latter is usuful when one wants to fill all plot area of a 2D graph with tiles.
[ref. data] section
One can select the reference data that is used to determine plot color in this section. One of z-, px-, py- and pz-data is available if a user has data in each axis.
[set as default]
The current settings are set to the default of the "density" plot by pressing this button.
[error] tab
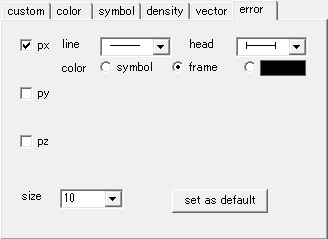
[px], [py] and [pz]
The px, py and pz data are used to draw error bars along x-, y- and z-axis, respectively, by checking corresponding check-boxes. After checing the following items will appear.
Caution: The pz error bar in a 3D graph is currently not drawn, even if one checkes the pz check-box.
[line]
One can select line type of the error bar by this combo-box.
[head]
One can select head type of each end of the error bar.
[color]
One can select color of the error bar by checking one of three radio buttons. "Symbol" is to make the error-bar color same as each plot symbol. And "frame" makes the error-bar color same as that of graph frame. Or one can choose any colors by clicking the black rectangle at right-hand side.
|
