|
|
[Edit]-[Label]
Select this item when you want to create a new label or to edit existing labels. If you have already created labels, the "Select label" window will open. Or the "Edit label window" will.
[Select label] window
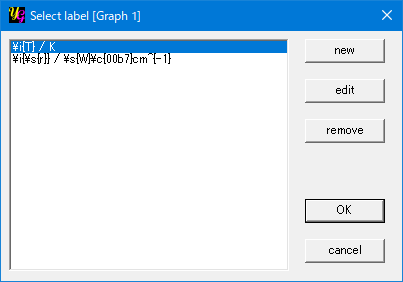
[new]
Press this button to create a new label. Then the "Edit label" window will open.
[edit]
If you have already created one or more labels, they will be listed in the list-box in the left side of the "Select label" window and this item will be enabled. By pressing this button the "Edit label" window opens and you can edit the label selected in the list-box.
[remove]
If you have already created one or more labels, they will be listed in the list-box in the left side of the "Select label" window and this item will be enabled. By pressing this button you can remove the label selected in the list-box.
[OK]
The "Edit label" window will close with saving the current label by pressing this button.
[cancel]
The "Edit label" window will close without saving the current label by pressing this button.
[Edit label] window
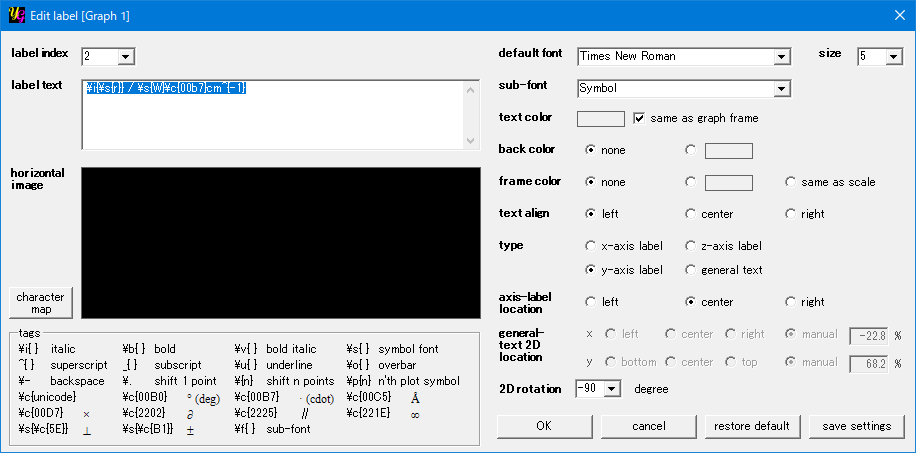
This window will open by pressing the "Edit" button in the "Select label" window then you can edit the selected label. This window also opens just after selecting [Edit]-[label]-[x-axis], [y-axis] and so on, when the graph does not contain any labels. In addition, when you double-click one of existing labels, you can directly reach this window.
[label index]
This list-box shows the index of the label that you are editting. You can change labels to edit by selecting another item in the list when you have two and more labels.
[label text]
You enter the body text to draw the current label in the graph. Many tags are available to change text styles as well ass to draw symbols. Details of how to use the tags are described below.
[show horizontal sample]
You can check how the current label will be drawn in the graph on this picture box. Even if you select the angle of rotation other than zero, the sample is drawn horizontally here.
[character map]
The caharacter map is shown by pressing this button. You can find character codes to draw symbols. The codes sometimes depend on the version of Windows OS.
[tags] section
Many tags are available to modify the font style, to draw symbols and to change character intervals.
\i{test} = test (itallc face)
\b{test} = test (bold face)
\v{test} = test (bold italic face)
\s{test} = τεστ (symbol font)
x^{10} = x10 (superscript)
H_{2}O = H2O (subscript)
\u{test} = test (underbar)
\o{test} = to draw overbar
\- = backspace (go back to the left)
\. = shift 1 point to the right
\{n} = shift n points to the right
\p{n} = to draw a plot symbol of the n'th file
\f{test} = to draw text with the "sub font".
[default font]
You can select a font to draw a label by this item.
[size]
You can set a relative size of the font to draw a label by this item.
[sub font]
You can select the second font to draw a label by this item.
[text color]
You can set a color of the label by this item. When the option "same as graph frame" is checked, the label is drawn with the same color as that of the graph frame.
[back color]
You can select a background color of the label by this item.
[frame color]
You can draw a rectangle frame around the label with the color selected by this item.
[text align]
This item is meaningful when you create a label including plural lines of different lengths from one another. Those lines are alinged to "left", "center" or "right" following the setting of this item.
[type]
One can place a label at an appropriate position as an axis title of the graph by selectiong the options like "x-axis label".
[x-axis label]
The label with this option is anchored at the center of the x-axis. In a 2D graph the label is also anchored under the x-axis numbers.
[y-axis label]
The label with this option is anchored at the center of the y-axis. In a 2D graph the label is also anchored at the left side od the y-axis numbers.
[z-axis label]
The label with this option is anchored at the center of the z-axis in a 3D graph.
[r-axis label]
The label with this option is anchored at the center of the right y-axis in a 2D graph. The label is also anchored at the right side of the right y-axis numbers.
[general text]
This is a general label. When you move a label on the graph using a mouse, the label type becomes "other", even if you created it as an axis title.
[axis-label location]
This option has meaning when the type of label is "x-axis label", "y-axis label" and so on. The axis labels are automatically located at left, center or right of each axis depending of the choice here.
[general-text 2D location]
The location of the label in a 2D graph can be set relative to x-axis left end and y-axis bottom end, respectively. You can put the label at the left, center, right of the x-axis and any position by entering a number in the text-box next to the "manual" radio-button. The similar things can be done for the y-axis position.
[rotation]
You can change the orientation of a label from -90, 0 and 90 degree using the list-box.
|
