|
[Plot]-[Symbol]
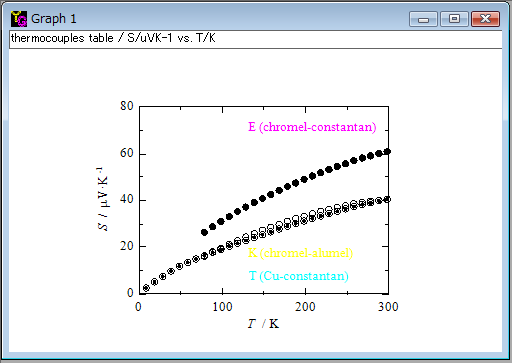
A graph is drawn in the "symbol" style when this item is selected. Data points are plotted with black symbols that you can select the "Data Selector" shown by [Data]-[Select Column]. The background color is white in the "symbol" style. I suppose you will use this style when you print a graph with a monochrome printer.

|


