|
|
[Mouse]-[Changing Plot Range]
You can change the plot range of a 2D graph by using a mouse.
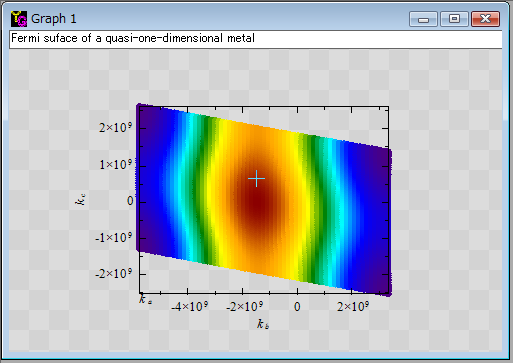
1) Move the mouse cursor into the plot area of a 2D graph.

2) Click the 2D graph. Then the mouse cursor changes from the default arrow to a cross. Here if you press the "ESC" key, the cursor becomes the default arrow and you can stop changing the plot range.
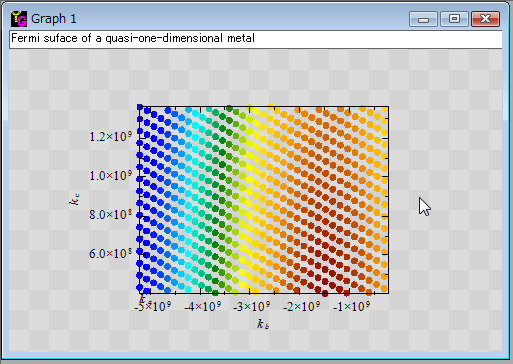
3) Drag a mouse with pressing its left button to define a new plot range on the 2D graph.

4) After releasing the left button, the graph will be redrawn with the new plot range.
5) When you plot the all data again, right-click the graph inside the plot range.
|
