|
|
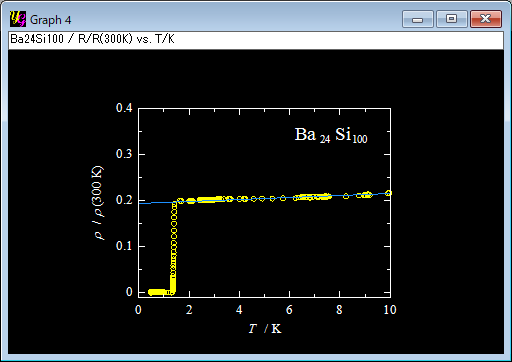
[Analyze]-[Fit Manual Line]
You can manually fit linear lines to the data in the 2D graph as you do the same thing by using a ruler on a piece of paper.
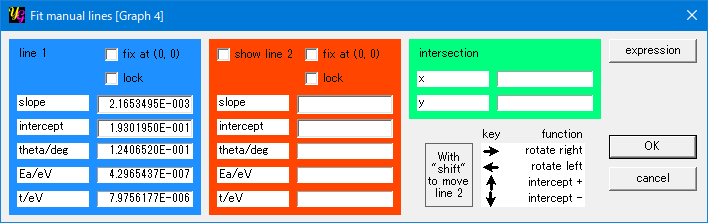
[line 1] section
[fix at (0,0)]
By making a check on this item, you can fix the first manual line to the origin = (0,0).
[lock]
By making a check on this item, you can lock the motion of the first manual line. This function protects the fitted line against unexpected key operations. You will find it useful especially when you have the second manual line.
[slope]
This item shows the slope of the first line, in other words, the coefficient of the linear term a of y = a x +b.
[intercept]
This item shows the intercept of the first line, in other words, the constant term b of y = a x +b.
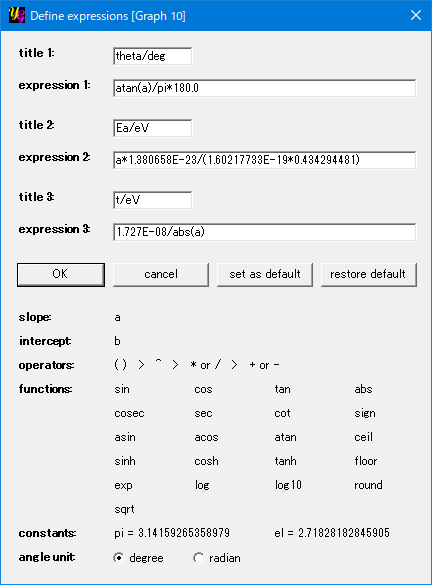
[theta/deg], [Ea/eV], [t/eV]
These are examples of quantities that are calculated by entering the slope and/or the intercept of the first line into expressiones you can define. In such expressions you can use mathmatical functions as you do in [Analyze]-[Convert Data]-[expression]. Press the expression" button at the right of the window to define an expression and to name it.
[line 2] section
[show line 2]
The second line will appear by making a check on this item. You can move the first and second lines independently.
[fix at (0,0)]
By making a check on this item, you can fix the second manual line to the origin = (0,0).
[lock]
By making a check on this item, you can lock the motion of the second manual line. This function protects the fitted line against unexpected key operations. You will find it useful especially when you have two manual lines.
[slope]
This item shows the slope of the second line, in other words, the coefficient of the linear term a of y = a x +b.
[intersept]
This item shows the intercept of the second line, in other words, the constant term b of y = a x +b.
[theta/deg], [Ea/eV], [t/eV]
These are examples of quantities that are calculated by entering the slope and/or the intercept of the second line into expressiones you can define. In such expressions you can use mathmatical functions as you do in [Analyze]-[Convert Data]-[expression]. Press the "expression" button at the right of the window to define an expression and to name it.
[intersection] section
This section is enabled when the second line becomes active and shows the information on the cross point of the first and second lines.
[x]
This item shows the x coordinate of the cross point of the first and second lines.
[y]
This item shows the y coordinate of the cross point of the first and second lines.
[key] section
This section shows functions of the keys to move manual lines. The functions will be disabled when
[→]
You can rotate the first line clockwise by pressing this key. Then both the slope and interception are changed. The speed of the rotation is increased on continuing to press the key. The speed becomes zero when you release the key. The second line is moved by pressing this key with the "shift".
[←]
You can rotate the first line counterclockwise by pressing this key. Then both the slope and intercept are changed. The speed of the rotation is increased on continuing to press the key. The speed becomes zero when you release the key. The second line is moved by pressing this key with the "shift".
[↓]
You can increase the intercept of the first line by pressing this key. The speed of the parallel motion is increased on continuing to press the key. The speed becomes zero when you release the key. The second line is moved by pressing this key with the "shift".
[→]
You can decrease the intercept of the first line by pressing this key. The speed of the parallel motion is increased on continuing to press the key. The speed becomes zero when you release the key. The second line is moved by pressing this key with the "shift".
[OK]
You need to press this button to show the manual line(s) in the graph.
[cancel]
If you press this button, the manual line(s) are not shown in the graph.
[expression]
You can edit the expressions to calculate quantities by using the slope and/or intercept of the fitted lines. By pressing this button "Define expressions" window opens. Three independent expressions can be defined through the window. Consult the [expression] section in the description of [Analyze]-[Convert Data], too.
|
