|
|
[Analyze]-[Convert Data]
[special]-[make table]
download sample
This is a kind of smoothing like [smooth], but by this item one can make a series of data with a constant interval in the x-axis. When one presses the button, the "Make equal interval table" window will open.
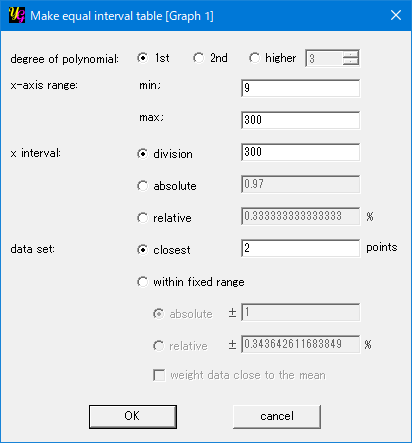
[degree of polynomial]
One can choose the degree of the power polynomial function used for the curve fit.
[x-axis range]
One can set the range of the table by setting the minimum and maximum of the x-axis. If the raw data do not exist in the vicinity of the max. and min., yoshinoGRAPH carries out extrapolation by using the closest data.
[x interval]
This item is used to determine the step of the table in the x-axis. There are three options.
division
The step is calculated as (x_max. − x_min) / division. Here x_min. and x_max. are those in the textboxes in the "x-axis range" section.
absolute
One can set the absolute value of the step.
relative
One can set the step relative to the full scale of the x-axis (x_max. − x_min.).
[data set]
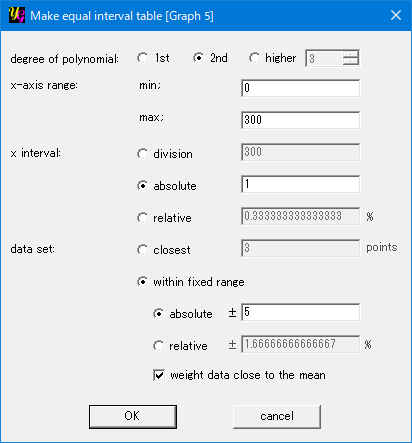
yoshinoGRAPH changes the x-axis value from the min. to the max. with the step, which are set in the previous sections. The software needs the data whose number is larger than the degree of the polynomial. For example, to fit a quadratic curve, at least, three data points are needed. Here we have two options to find such data.
closest
The "n" points data that is closest to the current x-axis value are used to calculate the y-axis value of the table. For every x-axis value in the table, yoshinoGRAPH searches the "n" data points in the original data. Making the "n" larger gives the smoother table. Note that some data points might not be used when the number of the original data is large and the interval of the table is rough. Further, when the intervals of the data points in the original data strongly depend on the x-axis area, the range of the data set used for each curve fit strongly depends on the x-axis value.
within fixed range
In this option, the reference range of the original data is strictly determined by the "absolute" or "relative" values.
absolute
By this option, to calculate the y-axis value at an x value, yoshinoGRAPH uses all the data in the range of x ± the value in the textbox.
relative
By this option, to calculate the y-axis value at an x value, yoshinoGRAPH uses all the data in the range of x ± Δx determined by the ratio in the textbox to the full scale of the x-axis, namely x_max − x_min.
weight data close to the mean
By this option, one can make the table soother when the original data are rather scattered. Each data point in the data set for the curve fit will be weighted depending on its distance from the current x value in the table calculation. The weight is 1 when the data is exactly at the x value; and 0 at the ends of the reference range. The weight linearly changes between 0 and 1 for the other data in the set.
Followings are how to make tables from original data, which are scattered artificially for the purpose of the illustration. You can download the sample file here.
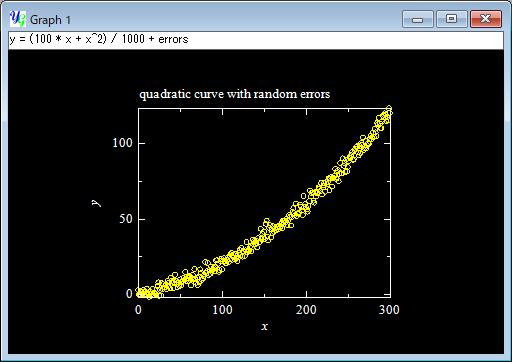
Here you have the original data created by adding artificial errors to y = (100 * x + x^2) / 1000.
Anyway you can make a rough table by using the settings below.
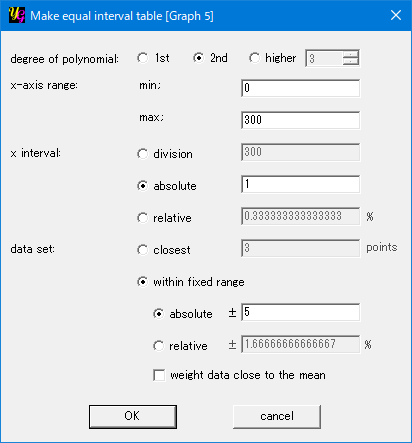
This is the result. The table is not a smooth quadratic curve since the original data (yellow) were scattered and the absolute reference range was narrow (±5). You will find many sudden changes in an enlarged scale.
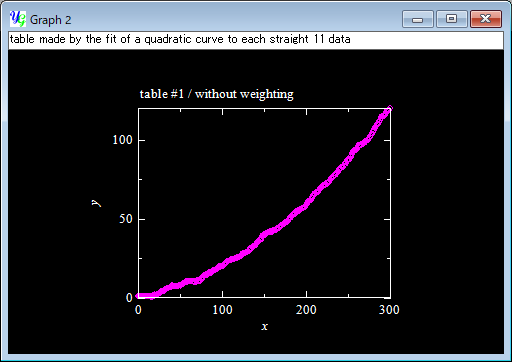
You can make the table smoother simply by increasing the reference range to ±10 or ±20. But here let's try another way, tick the option "weight data close to the mean" at the bottom; and press the "OK" button.
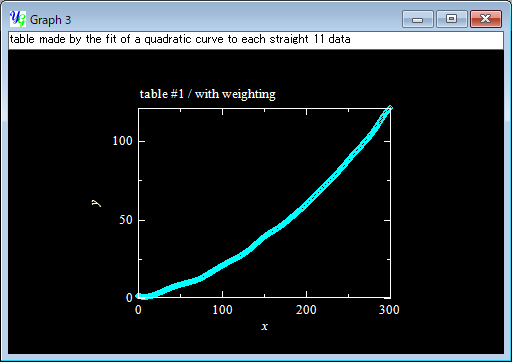
This time you see a smoother table (sky blue) thant the above (pink), while the curve is still fluctuating.
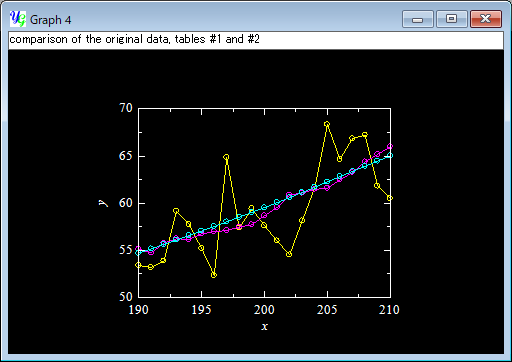
The below is the comparison of the original data (yellow); and the tables calculated with (sky blue) and without ticking (pink) the option "weight data close to the mean" between x=190 and 210. When you need a complete quadratic curve, you should try [Analyze]-[Fit Power Polynomial]. The current function is useful when you don't know any appropriate model to describe the original data, or the data curve is not expressed with a simple polynomial function.
|


