|
|
[Analyze]-[Control 3D Graph]
You can modify settings of a 3D graph by this item. The "Control 3D" window opens by selecting [Analyze]-[Control 3D Graph].
[rotation tab]
You can change view points of a 3D graph by using following buttons. The view point is defined by rotation angles around x-, y- and z-axes. The distance between the view point and the center of the 3D graph is a constant.
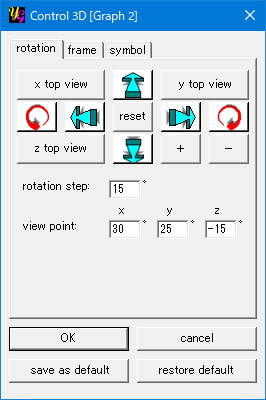
[x top view]
The view point is set to (-90º, 90º and 0º). This gives the view along the x-axis from the plus side.
[y top view]
The view point is set to (-90º, 180º and 0º). This gives the view along the y-axis from the plus side.
[z top view]
The view point is set to (0º, 0º and 0º). This gives the view along the z-axis from the plus side.
[up arrow]
The rotation angle around the x-axis is decreased by an angle defined in "rotation step".
[down arrow]
The rotation angle around the x-axis is increased by an angle defined in "rotation step".
[right arrow]
The rotation angle around the y-axis is decreased by an angle defined in "rotation step".
[left arrow]
The rotation angle around the y-axis is increased by an angle defined in "rotation step".
[right-rotation arrow]
The rotation angle around the z-axis is decreased by an angle defined in "rotation step".
[left-rotation arrow]
The rotation angle around the z-axis is increased by an angle defined in "rotation step".
[reset]
The view-point angles will be set to the default values of (30º, 25º, -15º).
[rotation step]
You can change the step of changing the view-point angles by the arrow buttons using this item.
[abs. rot. angle]
The three textboxes show the view points angles. You can also change them directly by entering numbers there. Then the graph will be rotated around each axis by the angles you wish.
[frame tab]
You can change settings of frame style on this tab.
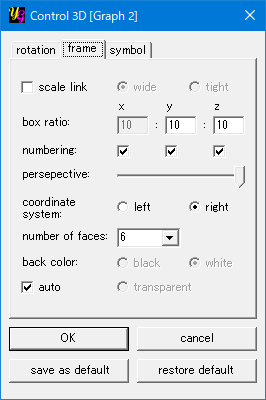
[scale link]
The scale-link option is activated by making a check on this item. The "scale link" means that the scale reflects the absolute values of plot ranges in the three axes. In other words, the scale of each edge of the cube/cuboid is normalized by the largest plot range of the three axes. This function is useful when you need to observe the distance and/or angle between data points in an absolute value.
When the radiobutton [wide] is checked, the graph is drawn with an identical plot range for all the three axis.
When the radiobutton [tight] is checked, the box becomes as tight as possible to show the data within the plot range.
[box ratio]
The default box ratio is 10:10:10 = 1:1:1, namely the box is a cube. You can change the cube into a cuboid by entering numbers to two textboxes corresponding to y- and z-axes. The number for the x-axis is always fixed to 10.
[numbering]
The numbering of each axis is controlled by this item.
[perspective]
The degree of perspective is chenged by this slidebar. The perspective will be off at the left side.
[coordinate system]
Usually you should use the right-handed coordinate system to make a 3D graph. But if you wish to change the order of plotting data along the z-axis by some reason, it might be useful to use the left-handed system.
[number of faces]
yoshinoGRAPH draws the cube/cuboid of a 3D graph by drawing six squares/rectangles. You can choose 0, 1, 3 and 6 as the number of squares/rectangles by using this item.
[plot symbol]
You can choose circle, dot or density as a plot symbol by this item.
[back color]
You can change background colors of a 3D graph by this item.
When [auto] is checked the background color is "White" for the "circle" and "density" plots; and "Black" for the "dot" plot, respectively.
When the check of [auto] is off, you can select the color by using radiobuttons [black], [white] and [transparent].
[symbol tab]
You can change settings of plot symbols on this tab.
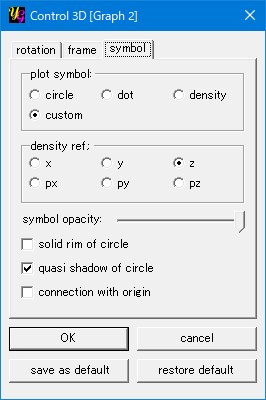
[plot symbol]
You can change plot styles directly by selecting the radio-buttons "circle", "dot", "density" and "custom". In the "custom" plot, "circle", "dot" and "density" style can be independently appled to each data file through [Data]-[Select Column].
[density ref.]
In the "density" plot, the color of each data point is determined by refering its z-, px-, py- or pz-axis value. You can switch them by selecting the radio-buttons here.
[symbol opacity]
Partially transparent symbols can be drawn by sliding this bar to left.
[solid rim of circle]
Solid (black) rim is drawn at each data point by checking this option when the "circle" style is applied.
[quasi shadow of circle]
Gradation color mixing plot color with black is used to draw data points in the "circle" style.
[bottom buttons]
[OK]
The "Control 3D" window closes after clicking this button. The modification you made will be reflected in a newly drawn 3D graph.
[cancel]
The "Control 3D" window closes after clicking this button. The modification you made will not be reflected in a newly drawn 3D graph.
[save settings]
You can save the current settings as default by clicking this button.
[restore default]
You can restore yoshinoGRAPH's original settings by clicking this button.
|
