|
|
[Analyze]-[Convert Data]
[special]-[roughen]
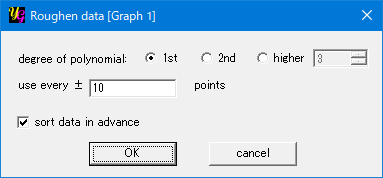
Thsi is the opposite function to [smooth]. The difference between raw data and locally fitted function are generated as a new data set. When one presses the button, the "Roughen data" window opens.
"Order of polynomial"
One can choose the order of the power polynomial function used for the curve fit.
"use ± n points"
The number of neighboring data used for calculating fitted polynomial functions. When one has a series of data of, say, 1000 points in a graph and uses the default setting "10", the calculation is carried out from the 11th to 990th data points so as each point has neighboring 10 points at its both plus and minus sides. Each locally fitted curve f(x) is obtained by using the 21 points including the center one. Then the first new y-axis value is calculated as y11 - f(x11) at x=x11. The process is repeated until x990.
"Sort data in advance"
Note that the "neighboring data" above means the data are not neighboirng on the graph but in a original data file. If one wants the former, check this option. The the data are sorted along the x-axis before calculation.
|
