|
|
[Analyze]-[Convert Data]
[special]-[subtract line]
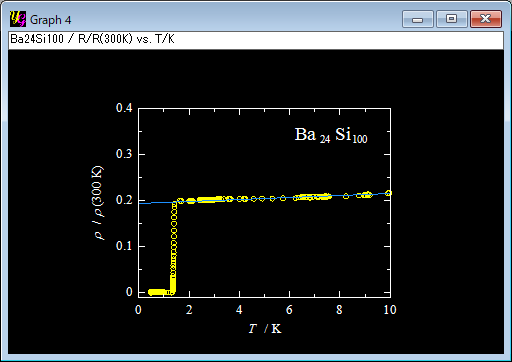
This item is enabled after you carry out [Analyze]-[Fit Regression Line] and/or [Fit Manual Line]. Then you have a graph like this.
You can subtract the y value of a line from the data poins using its slope and intersection. The "Select line" window opens by clicking the "subtract line" button.
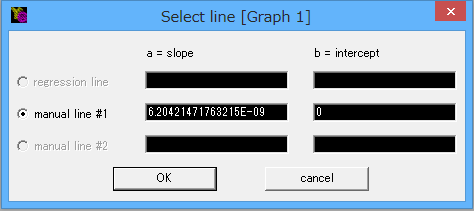
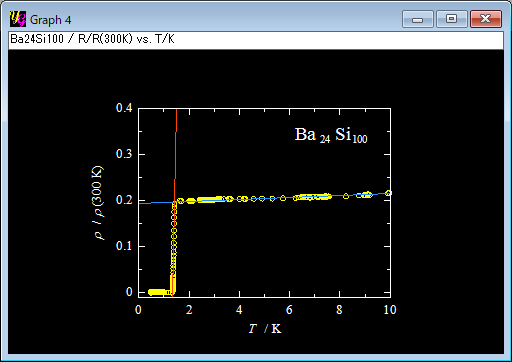
Then you simply select a line to use by the corresponding radio-button. You can also edit numbers if you do not like the result of fitting. After pressing the "OK" buttons on the "Subtract line" and "Convert data" windows, you will have a graph like below.
|
