|
|
[Analyze]-[Plot Range]
This item is to change plot area of the graph. By selecting this menu the "Input plot range" window opens.
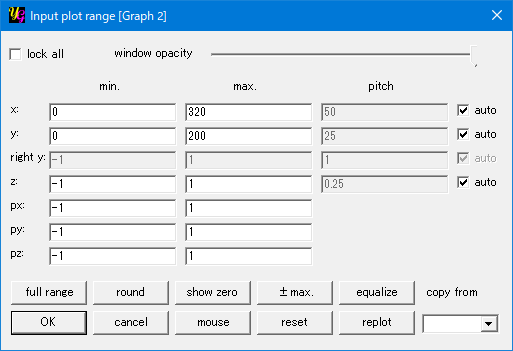
[lock all]
Mark a check on this item to suppress automatic search of max. and min. of each axis and to keep the plot area.
[window opacity]
You can change the opacity of the "Enter min. and max." window by shifting this slide-bar. This is convenient when you want to determine a new plot area by lookong at the current graph. This function is effective for WindowsXP or later.
[min.] section
Enter a preferred number in each text-box to change the lowest limit of each axis.
[max.] section
Enter a preferred number in each text-box to change the highest limit of each axis.
[pitch] section
A text-boxe in this section becomes enabled state when its neighboring check-box "auto" is off. Or pitch of each axis is automatically determined by yoshinoGRAPH. yoshinoGRAPH gives the most appropriate pitches in most cases. You might, however, needs a 15- or 30-degree step for angle data. This function is useful in such cases.
[full range]
You will have min. and max. values for each axis to plot all the visible data in the graph in the area as small as possible by clicking this button.
[round]
Each value of max. and min. is rounded to a multiple of the pitch. This function is useful to make a better lookong of the graph scale.
[show zero]
When you want to include zero in the plot range of each axis, press this button.
[reset]
By pressing this button, you can reset the changes that you made after opening this window.
[mouse]
If you want to point the corners of the new graph area by the mouse, press this button.
[replot]
This redraws the graph by using the plot range that you are editting on this window.
[copy from]
This item is active when the current project contains two or more grapg windows in it. Then you can copy the plot range setting from another graph by selecting it from the list-box.
|
