|
|
[Plot]-[With Error Bar]
This option is enabled when you make a check in, at least, one of the "px", "py" or "pz" checkBoxes on the "error" tab on the "Data selector" window that is shown when you read data files. And you can draw 2D graphs with error bars.
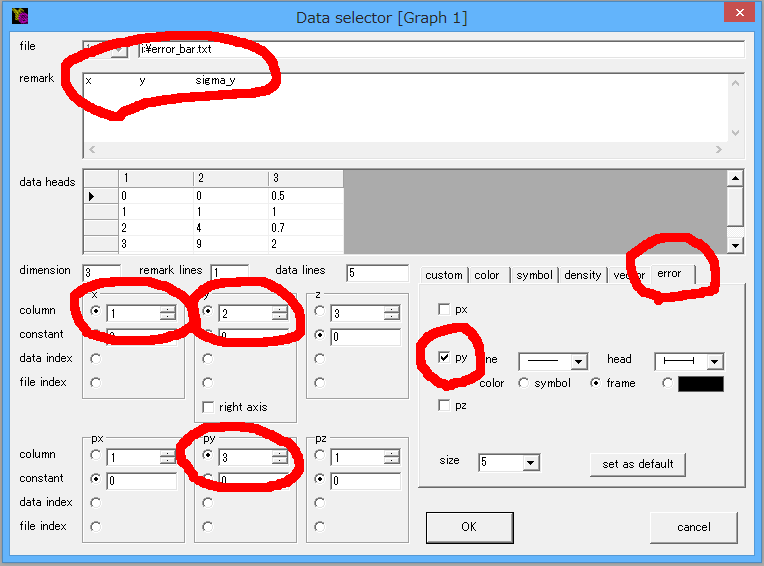
When you read this sample text file with yoshinoGRAPH by, for example, [Data]-[Read], the "Data selector" window will open. The text file contains three columns x, y and sigma_y (=y error). So you assign the first, second and third columns to "x", "y" and "py" data. You can leave the assignment for "z" as it is, or also assign a constant as int the sample below.
Next you click the "error" tab at the right side and check in the "py" checkBox. You will have the settings like below.
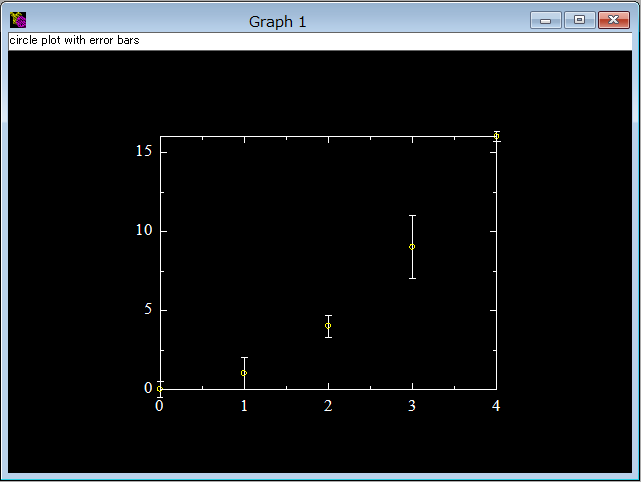
Finally you press the "OK" button and get the plot like this.
|
